
PROJECT 4: INFOGRAPHIC POSTER DESIGN
Description:
Infographics are an increasingly popular way of sharing information in newspapers, magazines, and online
news sites. These visual representations of knowledge and information are designed to make complex ideas and large amounts
of data easy to understand.
Conceptual & Aesthetic Direction:
Produce a statistical, research-based, or informational infographic as a formative and influential assessment of information. Conduct research and gather information to use for the infographic poster. Working with color, typography, graphics and layout to impact the audience, presenting the infographic to persuade, convince, or inform, using technology tools and data visualizations to create the infographic. Demonstrate mastery of the issue or organization with content-specific information included in the infographic.
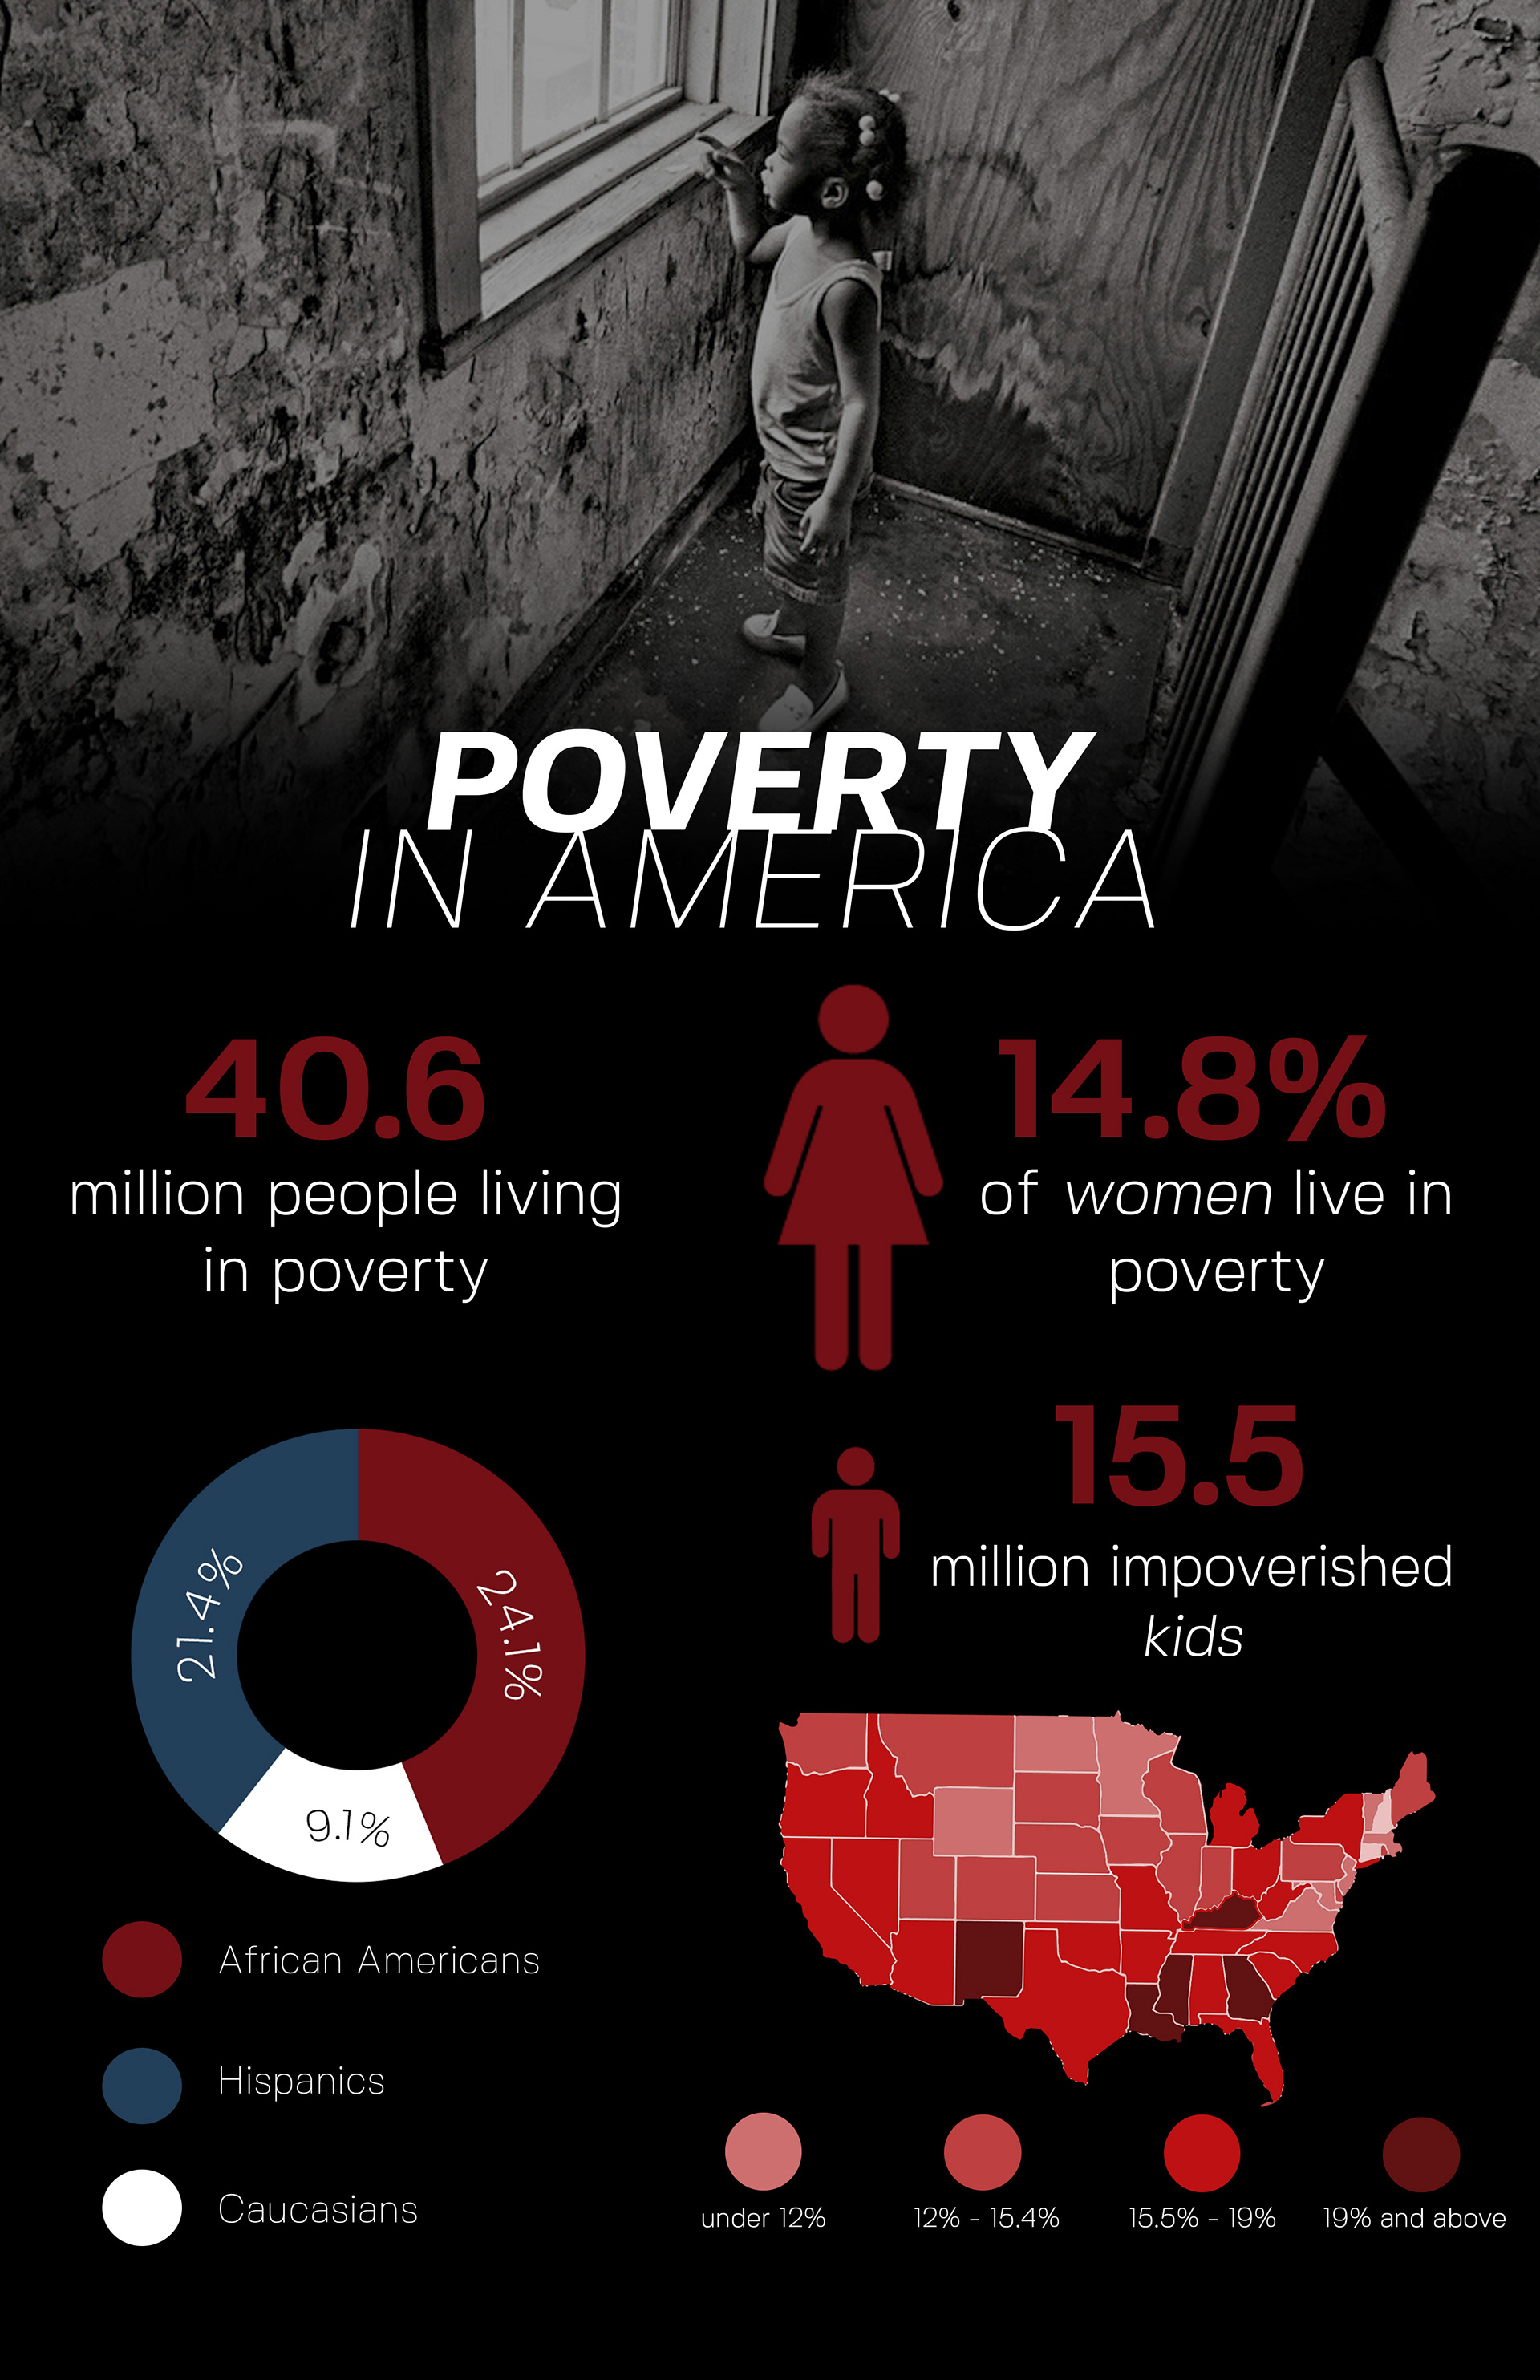
JAYLA CURTIS
Poverty In America Infographic
MEGAN HAASE
Migrane Intervention Infographic

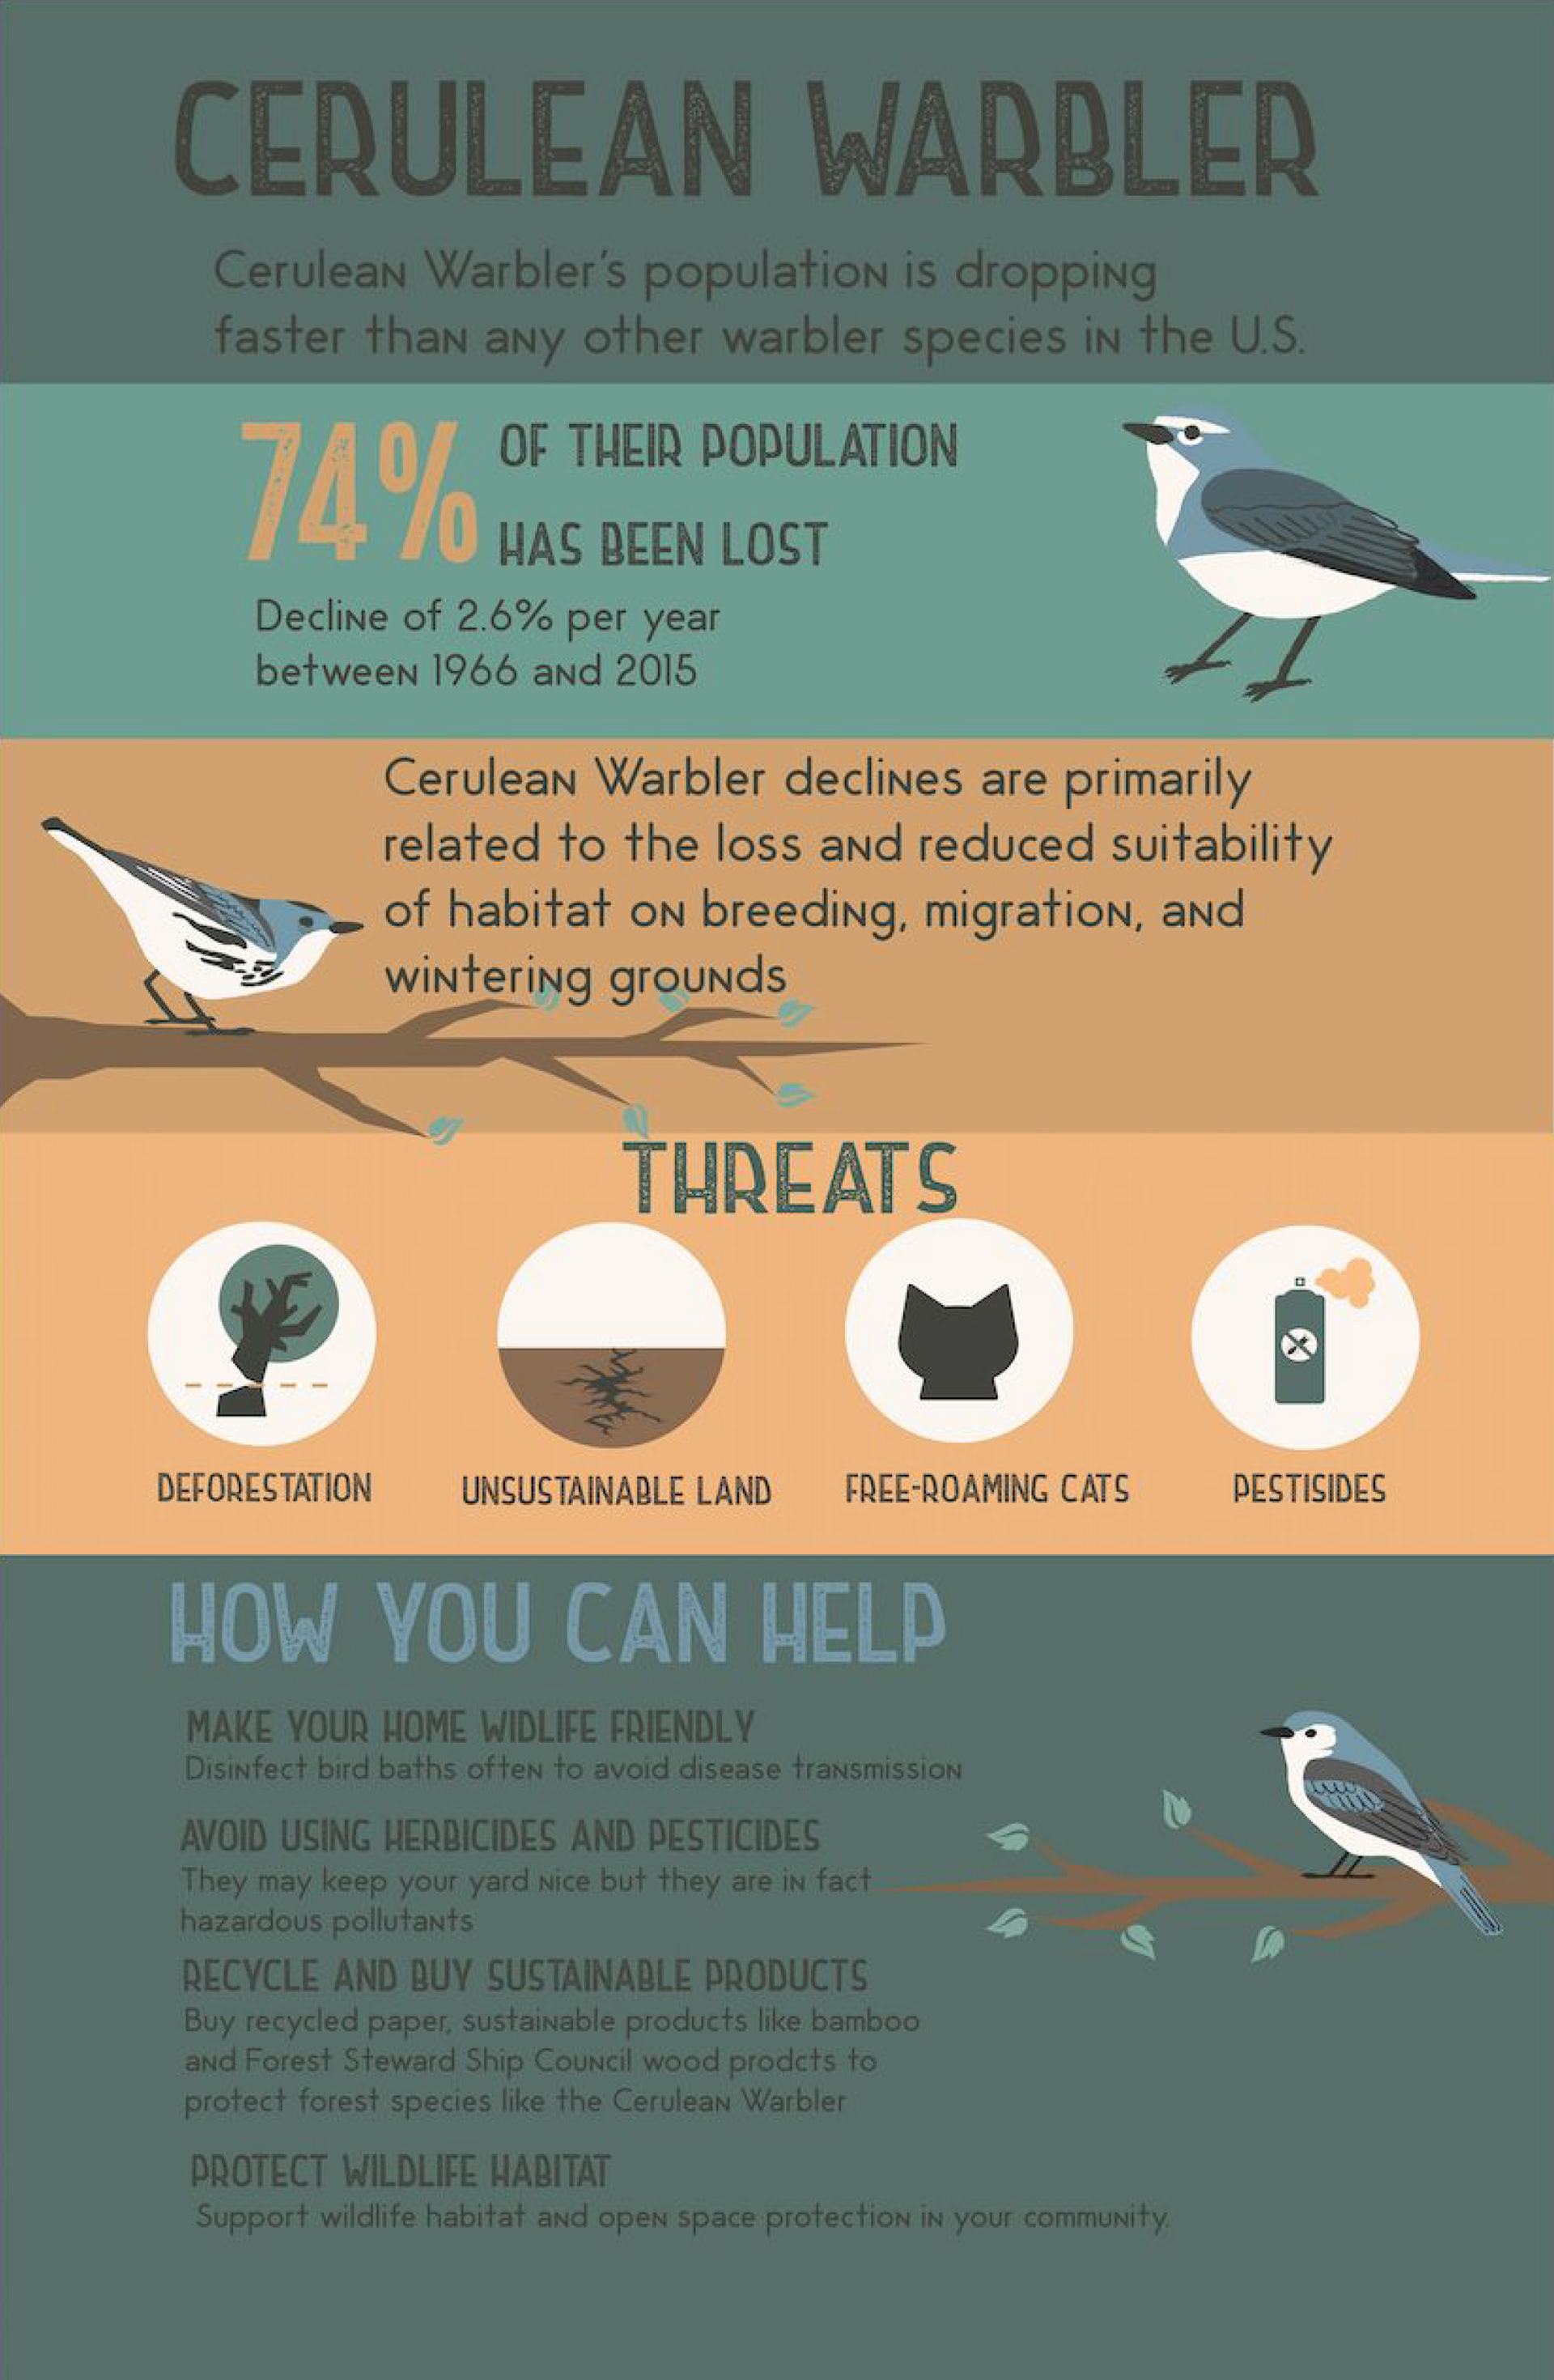
SOPHIA VELASCO
Cerulean Warbler Endangered Species Infographic
A Brief History of Infographics
Images predate not only today’s graphic-laden media but also written language itself. Petroglyph’s, were the earliest forms of non-verbal communication created by prehistoric societies, and are found on all continents except Antarctica. They evolved into more advanced pictograms such as the Sumerian cuneiform script and the Egyptian hieroglyphs, which in turn led to linguistic writing that we use today.
Throughout most of this history, image and type have remained inextricably mixed. From ancient holy books to Renaissance writing, authors have strived to integrate visuals and script into a coherent whole. However when technology intervened in the form of movable type, visual expression became separated from written text because of the different production processes and
the skills required to produce them.
With the advent of desktop publishing in the late eighties, and the emergence of the field of information design in the nineties, the infographic movement has regained its lost momentum.
Infographics convey information about a topic in a way that is easily digestible to the reader. An infographic is usually not about an organization itself nor an advertisement for an organization. It should show data / statistics on the current status of an issue contrasted with something a little shocking that will spur action – it should make the reader think: “Now I understand why this
issue is important, why the author created it, and that there is a real need there.”